
Is Your Amazon Ads CPC Too High? How to Benchmark Against Your Category

Amazon Ads CPC in 2026 typically runs $0.75 to $1.30 for Sponsored Products, with a blended average across all ad types closer to $1.10 to $1.20. Conversion rates average 9% to 12% platform-wide, and well-optimized listings reach 12% to 18%.
Category decides whether either of those numbers means anything. The same $2.50 CPC that signals a healthy supplements account signals a serious problem in office products, and no blended platform average will tell you which situation you are in.
Pull your trailing 90 days of CPC, conversion rate, ACoS, and TACoS, compare each against your own category rather than the platform figure, and read CPC and conversion rate as one paired signal. When conversion rate has slipped, adjusting bids treats the symptom.
What Changed in the Amazon Ad Auction
Advertiser density is the reason your costs rose without you touching anything. Far more sellers run ads today than five years ago, and every new entrant bidding on your keywords lifts the clearing price regardless of how well your account is built.
That matters for how you read your own numbers. A cost increase driven by auction participation is a market condition rather than a performance failure, and the two call for completely different responses.
Bid adjustments fix performance failures. Market conditions get answered with keyword strategy, listing conversion, and campaign structure, because those are the levers that still move when the auction gets more crowded. Full-funnel Amazon advertising covers what that restructure looks like for an account still running mostly Sponsored Products.

Where Your Category Falls on the CPC Curve
Ad type sets your starting point before category does anything. Sponsored Brands runs higher at roughly $1.10 to $2.50, and Sponsored Display sits lower at $0.80 to $1.60, so an account weighted toward Sponsored Brands will show a higher blended CPC without any inefficiency behind it.
Category then spreads those figures wide. Books and office products often sit under $0.85 because fewer advertisers compete and average selling prices stay low. Beauty, supplements, and electronics regularly clear $2.00 on competitive keywords, with some head terms running past $3.00.
Long-tail keyword strategy remains the most reliable way to pull costs down without losing volume. Head terms in competitive categories typically cost three to five times more than targeted long-tail variations serving the same buyer intent.
That gap is where most recoverable spend lives. Shifting budget toward long-tail terms usually closes a cost gap faster than any bid change, and it does it without surrendering impression share.
Why Conversion Rate Behaves Differently on Amazon
Amazon converts several times better than other advertising platforms because the traffic arrives with purchase intent already formed. Someone searching a product term on Amazon has usually decided to buy something and is choosing between options.
Category shapes the outcome as much as it does on the cost side. Food and beverage products regularly convert at 15% to 17% on repeat-purchase behavior, while electronics can fall to 4% to 6% because research cycles run longer and price points invite comparison.
When your conversion rate sits below your category norm, the fix usually lives on the listing rather than in the campaign. Title clarity, image quality, and review position move conversion more than any bid adjustment will, and Amazon listing optimization runs that diagnostic end to end.
AGL's work with Ray-Ban is a useful reference point. Conversion rate tripled after a full listing rebuild, with no corresponding increase in ad spend, which places most of the conversion story outside the ad console entirely.

The Benchmark Trap Most Accounts Fall Into
Cost and conversion only mean something when you read them together. A cheap click buys nothing if the listing cannot convert it, and a strong conversion rate cannot rescue a campaign where cost per click has already eaten the margin.
This is where accounts misdiagnose themselves most often. A rising ACoS gets blamed on cost creep when the actual driver is a conversion rate that slipped quietly behind a stale listing or a competitor's price drop.
Check whether the conversion rate moved before you touch a bid. The sequence matters more than the individual adjustment.
ACoS and TACoS: The Numbers That Tell The Real Story
ACoS and TACoS are what tell you whether the advertising is working at all. Healthy ACoS in 2026 generally sits between 25% and 35% for mature campaigns, with top-performing accounts holding 22% to 26%.
Launch-phase campaigns run considerably higher, often 30% to 60%, while a new product builds review volume and ranking. Judging launch campaigns against mature targets is one of the fastest ways to kill a product before it establishes itself.
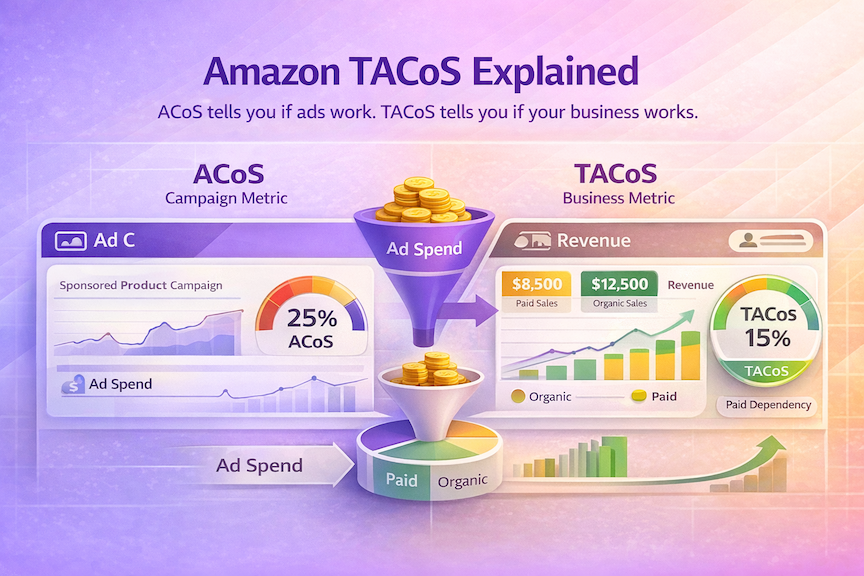
TACoS is the number worth managing the whole account by, since it counts organic sales alongside ad-driven ones and reveals whether advertising is compounding into rank or simply renting it. A healthy TACoS generally falls between 10% and 15%, and what TACoS measures that ACoS misses covers the diagnostic quadrants for reading the two together.

How to Benchmark Your Own Account
Start with the trailing 90 days and compare every metric against your specific category. Category mismatch is the single most common reason sellers misjudge accounts that are performing fine.
Separate your campaigns by lifecycle stage before you draw any conclusion. A launch and a mature review-heavy listing should not share an ACoS target even inside the same account, because blending them hides which campaigns are actually underperforming.
Then treat cost and conversion as one paired scorecard. When both sit in a healthy range for your category and ACoS still looks high, the problem is usually structural, such as campaign overlap or wasted spend on broad match, which no bid adjustment will resolve on its own.
Amazon PPC management covers the campaign architecture work if that is where the gap turns out to sit.
Ready to See Where Your Account Stands?
Benchmarks only help once you know where your own numbers fall against them. Get a free audit of your Amazon Ads account and find out whether your cost, conversion, and ACoS are ahead of your category or leaving margin on the table.

Frequently Asked Questions
How do I find the CPC benchmark for my own category?
Pull your Search Term Report for the trailing 90 days and segment by your top-converting terms rather than by campaign, since campaign averages blend branded and non-branded traffic. Compare your non-branded cost per click against the range your competitors are visibly bidding into, which you can approximate from Brand Analytics search frequency rank and top clicked products. Your own trailing twelve months is the more useful reference once you have it.
My conversion rate dropped but I have not changed the listing. What happened?
Look outside your own listing first. A competitor price drop, a new entrant with stronger reviews, or a seasonal shift in buyer intent will all move your conversion rate while your page sits untouched. Check whether your Featured Offer share moved in the same window, since losing it suppresses conversion sharply without any content change on your side.
How long should a launch campaign run at elevated ACoS before I intervene?
Give it enough time to accumulate review volume and ranking data, typically 60 to 90 days depending on your category's purchase cycle. Intervene early only when impressions are healthy and click-through is weak, which points at creative rather than bidding. Cutting spend before ranking establishes usually forces a second launch at higher cost.
Why did my cost per click rise when I did not change my bids?
Your bid sets a ceiling rather than a price, so what you actually pay moves with whoever else enters the auction. New advertisers, competitors raising ceilings, and seasonal demand shifts all raise the clearing price underneath a bid you never touched. Relevance also matters, since a listing whose conversion has slipped will pay more for the same placement.
My category has no clean benchmark. What do I use instead?
Build your own. Take your trailing twelve months, isolate the periods where profitability met your target, and treat those figures as your working baseline. A self-referential benchmark is more useful than a borrowed one anyway, because it already accounts for your margin structure, your price point, and your review position.


Comments